Visual Indicators for the Masses: KPIs in WSS
SharePoint comes with really cool web parts for presenting key performance indicators, but these are only available in the Enterprise edition. If you are running Windows SharePoint Services or SharePoint Server Standard, it is not available. Which SharePoint technology is right for you?
In this article I will create the same KPIs as Mark did in Part 1, but I will use only Windows SharePoint Services functionality. In order to do that you will need Microsoft Office SharePoint Designer 2007. The only limitation of this concept is that you can only build KPIs on top of data stored in SharePoint lists.
Create a list
Create a simple SharePoint list to store KPI values.
Create a data view
In order to display KPI indicators we will use built-in Data View web part.
- Open a web part page where you want to create KPIs with SharePoint Designer
- Select a zone to place the web part
- Insert Data View web part to zone
- Wizard will guide you through the procedure
- (Details on how to customize Data View with SharePoint Designer)
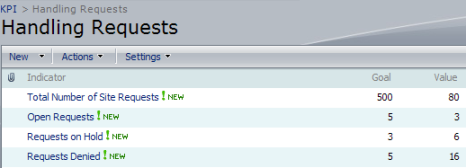
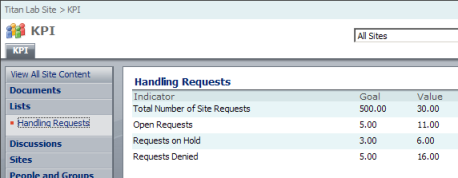
Your results should look like this:
Create KPIs
Now it’s time to create some fancy indicators to show if goal is reached. To do so you will need to open your page in SharePoint designer code view. Look for the following code defining the header of the list view
<th class="ms-vh" nowrap="nowrap">Indicator</th>
<th class="ms-vh" nowrap="nowrap">Goal</th>
<th class="ms-vh" nowrap="nowrap">Value</th>
Add an additional th tag. It will create one additional column to display our KPI status icon.
<th class="ms-vh" nowrap="nowrap">Indicator</th>
<th class="ms-vh" nowrap="nowrap">Goal</th>
<th class="ms-vh" nowrap="nowrap">Value</th>
<strong><th class="ms-vh" nowrap="nowrap">KPI</th></strong>
Now we will need to add actual code to display the image. Look for the following code:
<td class="ms-vb">
     <xsl:value-of select="format-number(@Value, '#,##0.00;-#,##0.00')"/>
</td>
The code above displays the value of the Value column of our list. Paste the following code below it.
<td class="ms-vb">
<img alt="KPI Status Icon">
<xsl:attribute name="src">
<xsl:choose>
<xsl:when test="number(@Value) <= number(@Goal)">/_layouts/images/KPIDefault-0.GIF</xsl:when>
<xsl:otherwise>/_layouts/images/KPIDefault-2.GIF</xsl:otherwise>
</xsl:choose>
</xsl:attribute>
</img>
</td>
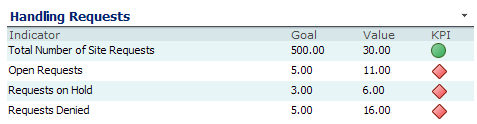
The solution is very simple. It will show green light when the value is lower than or equal to the goal or red light when this condition is not satisfied. For this article I have used default SharePoint icons, but change URLs above to use your own KPI icons.
KPI advanced features
The built in KPI web part gives you some additional features that cannot be replaced with the solution proposed above. Let’s expand our solution to fix that.
Add the following columns to your list:
- BetterValuesAre – Choice column – Two options: Lower and Higher
- GreenIndicatorThreshold – Number column
- YellowIndicatorThreshold – Number column
We are going to use these columns to allow different rules to be applied to KPI Status Icons. Data View will not add new columns into view by default and you will have to do that manually.
<td class="ms-vb">
<img alt="KPI Status Icon">
<xsl:attribute name="src">
<xsl:choose>
<xsl:when test="@BetterValuesAre = 'Lower'">
<xsl:choose>
<xsl:when test="number(@Value) <= number(@GreenIndicatorThreshold)">/_layouts/images/KPIDefault-0.GIF</xsl:when>
<xsl:when test="number(@Value) <= number(@YellowIndicatorThreshold)">/_layouts/images/KPIDefault-1.GIF</xsl:when>
<xsl:otherwise>/_layouts/images/KPIDefault-2.GIF</xsl:otherwise>
</xsl:choose>
</xsl:when>
<xsl:otherwise>
<xsl:choose>
<xsl:when test="number(@Value) >= number(@GreenIndicatorThreshold)">/_layouts/images/KPIDefault-0.GIF</xsl:when>
<xsl:when test="number(@Value) >= number(@YellowIndicatorThreshold)">/_layouts/images/KPIDefault-1.GIF</xsl:when>
<xsl:otherwise>/_layouts/images/KPIDefault-2.GIF</xsl:otherwise>
</xsl:choose>
</xsl:otherwise>
</xsl:choose>
</xsl:attribute>
</img>
</td>
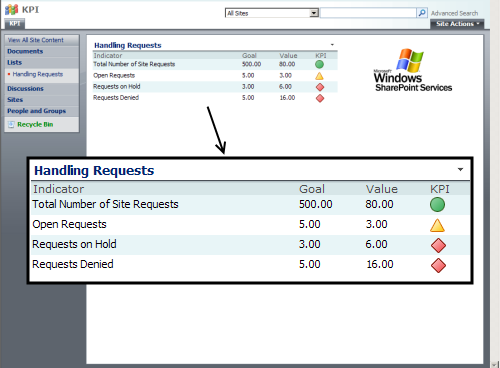
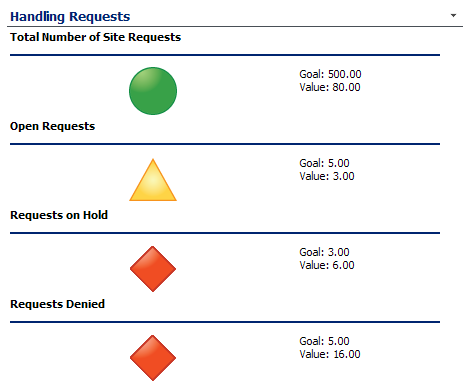
The final result is shown in the following figure.
The table format is not mandatory for Data View web part. You could also use “repeating layout” to create something like this.
In the next article of these series we are going to examining how to embed the KPI view in your list and how to handle KPI calculations based on Date Values.
Author: Toni Frankola
SharePoint Use Cases
Toni started his Web adventure in late 90’s and has been working with various web technologies ever since. Today he is primarily focused on Microsoft Office SharePoint and Dynamics CRM. He works at Perpetuum Mobile, a Microsoft Gold Partner from Croatia. Toni is leading project engagements and managing a team of consultants specialized in Microsoft technologies.


Note that we can get the same result without SharePoint Designer:
http://pathtosharepoint.wordpress.com/2008/09/01/apply-color-coding-to-your-sharepoint-lists/
(see the “indicator” column)
Christophe
Christophe – The purpose of this article is to show alternative ways to do the same thing. Yes, you and I both have a solution for this, but Toni has provided us with another, viable alternative. The more angles to look at, the more people will learn. — Mark
Well, that’s one of many reasons that I really love SharePoint – you can achieve the same result in any which way that works for you. :)
Mark and Martin: I agree, but then it would be useful for the readers to understand the trade-offs, and which method is better in which case.
Let me start with the advantages of my method ;-)
- WSS, SharePoint UI only. No need for MOSS or SharePoint Designer
- site still supported by Microsoft (same reason, no use of SPD)
- site/list can be exported and reused as template
- applies to list views (table, boxed, newsletter), calendar views and display forms (DispForm.aspx)
- grouping in lists will work in both IE and Firefox (doesn’t work in Firefox for the DVWP)
Hi!
I’m trying to implement my KPI list but I got an error:
“This web part does not have a valid XSLT stylesheet: Error: the character “<” can not be used in a value of an attribute.
/_layouts/images/KPIDefault0.GIF”
Please help me.
tanks
There is a problem with formula output, we will fix that ASAP.
In the meantime simply replace the operator ‘=’ with ‘>=’
Please disregard my last comment, it seems I cannot paste the operators in this box :(-. I will send you the update via email.
Thank you. Now it’s working :D
Toni – Try using ` (backticks) around the code and see what happens. — Mark
Ok, ignore my last suggestions, too. I’ll go in and make the changes manually. You should see it within the hour. — Mark
Ok, team. Everything is fixed and should be ready to cut and paste. — Mark
I am trying to create this KPI scorecard, but am running into a little trouble. I have created a List (i think its an access list) but i cant seem to be able to find the “Data View Web Part” you have mentioned. Is this something extra that i need to install?
@Alex: From your SharePoint Designer: Insert > SharePoint Controls > Data View
Hope it helps.
Thanks, I am now having the problem that every time I click and so select the values is would like to import into the data view. SharePoint Deisgner crashes has an error and wants to send this into to MS…
@Alex: This seems to be an issue with SPD. Try to reinstall the app.
You can also use SPD that is installed on a different computer in the same network…
Couldn’t one use the same XSLT techniques to display the KPI gifs in a multi-row, multi-column table from any data in any SP custom list with proper fragments grafted onto a DFWP using SPD(DVWP don’t exist in MOSS anymore)?
If so, VERY powerful.
Good news. You don’t need MOSS or SharePoint Designer to implement this. I have applied the same concept to a WSS 2 site and it works great! All that is needed is to export the list web part to a XSLT dataview in FrontPage, and the conditional formatting in the example does the rest. (Of course you have to create and store your own images in a library somewhere on the site.)
Hi,
I gave this a try, and got the first part working, where it’s either red or green. Now I’m looking at the more advanced area and not sure how it works.
Could you explain the 3 new columns we add to the list? How do they work etc?
I cant see the contents inside like XSL codes and the KPI icons i have tried with every browsers is there any way i can see the whole contents clearly or is it removed somewhere,
Uttam – Should be available now. — Mark
Hello
I created a linked data source from two lists – achievements and indicators.
Insert data from this list DVWP. Then put your miracle-code
Everything works fine, but the result for all rows is read only the first value from the list of indicators.
Sorry for bad English!